Bulletin 3429
Bulletin E-3429 Introduction to Pesticide Use and Planning
DOWNLOAD
August 8, 2024 - Erin Lizotte, Christina Curell, and Jonathan LaPorte, Michigan State University Extension
 Print
Print Email
EmailAs a new or beginning farm manager, you may be raising crops to reduce feed costs or to sell on the market. A common challenge to raising crops is managing various pests that would damage or limit potential yields. One of the important decisions in crop production is deciding what method of pest management to use and when.
Integrated Pest Management (IPM) is a multi-disciplinary approach to pest management intended to assist growers in making smart pest related decisions. It focuses on multiple pest suppression tactics to minimize negative human and environmental impacts. IPM users operate in a technology and information-intensive environment that helps them understand pest biology, consider all available tools and consider economic constraints.
IPM practitioners implement prevention, avoidance, monitoring and suppression strategies to address pests on the farm. Available pest management tools consider biological, cultural, mechanical, and chemical methods. This publication explores the process of using chemical pest suppression (e.g., pesticides) and is intended to help you develop a pesticide plan for your farm.
Pesticides 101
Pesticides are an important part of the Integrated Pest Management (IPM) suppression toolbox. The term pesticide encompasses a wide variety of products including insecticides, herbicides, fungicides, rodenticides and more! In agriculture, we are primarily focused on pesticides that help us address four groups of pests. These groups include:
- Weeds (unwanted plant species)
- Invertebrates (insects)
- Pathogens (disease agents including nematodes)
- Vertebrates (e.g., rodents)
Pesticide characteristics and classification
Pesticides are described and categorized based on a number of characteristics. Some of the most common descriptions include formulation, active ingredient, mode of action, target pest, conventional vs. organic, or restricted vs. non-restricted.
The formulation of a pesticide is a mixture of active and non-active ingredients. Formulations can affect how well pesticides dissolve (solubility) in water or when mixed, including the safety and handling of a pesticide during transportation or application. Formulations are often developed to optimize a pesticide for certain application parameters (site, equipment, environment). To learn more about pesticide formulations, check out the Pesticide Formulation Factsheet at the National Pesticide Information Center (http://npic.orst.edu/factsheets/formulations.html#references).
An active ingredient is the portion of a pesticide formulation that acts on the pest. It is important to recognize that active ingredients may be available under multiple labels or trade names. They may even be included at varying concentrations or rates between products.
The mode of action (MoA) describes how a pesticide affects the target organism. For example, some fungicides inhibit synthesis of key cell wall building blocks in fungi. Multiple active ingredients and products may have the same MoA. A pesticide’s mode of action is often noted on the label by a code that can assist growers in pesticide resistance management. Growers are commonly encouraged to rotate between modes of action to delay pest resistance development.
Pesticides are broadly categorized based on their target pest. For example, bactericides target bacteria while rodenticides target rodents or vertebrates. Some target pests may not be as obvious based on the common pesticide name. For example, fungicides target pathogens and herbicides target weeds.
There tends to be some confusion over the differences between conventional (synthetic) and organic pesticides. Many consumers believe that organic pesticides have no human or environmental effects or that organic crops production does not include pesticides at all. In reality, the difference between organic and conventional pesticides is simply the source of the pesticide. Organic pesticides include only naturally occurring substances like minerals (e.g., copper) or plant extracts (e.g., neem). Conventional pesticides may include naturally occurring or synthetically made materials. It is common for growers to utilize a combination of synthetic and organic pesticides.
Restricted use pesticides (RUPs) have the potential to cause unreasonable adverse effects to the environment and injury to applicators or bystanders. The "Restricted Use" classification restricts a product, or its uses, to be used by a certified applicator or someone under the certified applicator's direct supervision. In Michigan, pesticide applicators are certified through the Michigan Department of Agriculture and Rural Development (MDARD).
To learn about becoming a Certified Pesticide Applicator in Michigan, visit the Michigan Department of Agriculture and Rural Development website (https://www.michigan.gov/mdard/licensing/pesticide/pesticide-applicator-certification). For general information about pesticides, check out the National Pesticide Information Center (http://npic.orst.edu/).
Accurate and confident application
There are a number of factors that can make pesticide applications intimidating and complicated. Understanding complicated pesticide labels, locating reliable label information and accurately measuring pesticides are some of the most important parts of the process.
Understanding the label. Reading a pesticide label can be intimidating! Pesticide labels are considered legally enforceable, making it a violation of federal law to use a product in ways not consistent with the label directions—yet instructions can be unclear or confusing with a lot of legal language. University of Missouri has a great publication called Understanding the Pesticide Label (https://extension.missouri.edu/publications/g1911) that can help growers better understand labels.
Personal protective equipment. An important part of a pesticide label is the description of personal protective equipment (PPE). Pesticides are toxic and can be harmful if they reach your skin and eyes or are inhaled. PPE is specialized equipment needed to prevent you from being exposed to any harmful effects. A label will describe the type of PPE needed based on toxicity level, formulation, and activity you are performing. For example, PPE requirements may be different if you are measuring, mixing, loading or applying a pesticide. PPE can even be required during maintenance operations. Always use required PPE as described and instructed by the label. For more information, review the MSU Personal Protective Equipment Guidelines (https://ehs.msu.edu/_assets/docs/ppe/msu-ppe-manual.pdf).
Measuring pesticides. Measuring pesticides accurately is critical. Measuring errors can lead to crop damage, ineffective pest control, and environmental repercussions—not to mention that over application can be expensive in materials alone. There are also limits to how much of a pesticide’s active ingredient can be applied in a given year or certain parts of the country. Pesticide products may also have plant back requirements that last several months or years, which can impact next year’s planting intentions. To address these issues (and more), Purdue Extension has an excellent free publication called Measuring Pesticides; overlooked steps to getting the correct rate (https://www.extension.purdue.edu/extmedia/ppp/ppp-96.pdf).
Reliable label information. When accessing pesticide labels online, growers should carefully select their source of information to ensure that the information is up to date and relevant for their region of production. Once the product is in-hand, growers should again review the label. Pesticide labels can and do change so the safest route is to confirm the proper application instructions for each application. There are a number of reliable resources for accessing labels online, check out the National Pesticide Information Center (http://npic.orst.edu/ingred/proddata.html) for more info.
Additions to the tank. The efficacy of pesticides can be greatly impacted by the addition of adjuvants, tank mixing partners, acidifiers, neutralizers, anti-foam agents and more. Carefully reviewing the label is critical to understanding what might be required to get the most out of a pesticide application. Failure to follow the recommendations can result in crop injury, equipment issues and lack of efficacy. Penn State Extension has a thorough write-up on this topic (https://extension.psu.edu/spray-adjuvants), which is summarized below.
- Activator adjuvants include surfactants, oils, and nitrogen-based fertilizers. Surfactants bond with spray droplets and allow the droplet to stick and spread out over a surface area. Oils increase the penetration of spray droplets and help reduce surface tension. Nitrogen-based fertilizers help improve herbicide activity when used in the spray solution.
- Specialty or utility adjuvants are also used to reduce or prevent conditions that may impact pesticide application. Examples include conditioning agents modify spray water pH for better performance. Defoaming agents reduce foam developed in a spray tank. Deposition agents increase a pesticide’s ability to stick to a surface. Drift retardants form larger droplet sizes to reduce movement away from target pests. Colorants help to make deposition or coverage on a surface visible. Suspension agents extend the amount of time that pesticides remain suspended in a mixture.
To learn more about safe pesticide application and regulations, check out the Michigan Pesticide Applicators Virtual Classroom online course (https://www.canr.msu.edu/courses/pesticide-applicator-training).
Creating a Pesticide Plan
Planning in advance for pesticide applications can be difficult because each crop year is unique. Additionally, some pesticides are applied preventatively (in anticipation of pests), and some are curative (in response to pests). An IPM approach can help address many of these variables through a strategic approach that includes setting goals, understanding pest biology, monitoring for pests, implementing management strategies and evaluating the success of the program.
The first step is to identify potential pests and know their biology. This information is critical to understanding monitoring tactics, potential pest impact, management practices that are likely to work and how to optimize management. For example, understanding a pest life cycle can direct monitoring activities, identify critical control periods and determine what pesticides should be utilized. Growers are encouraged to build a calendar of potential pest activity for the crop and region of interest. For many crops, these pest calendars have been developed and can be refined by the user to better reflect farm conditions and grower experiences.
Setting IPM goals requires deciding if your plan will prevent, suppress, or eliminate (eradicate) potential pests. In Michigan, some pesticide applications are preventative. Products are applied based on the knowledge that specific pest issues always arise and/or that curative treatments are ineffective. Fungicides, herbicides and nematicides are commonly used at least partially in a preventative fashion. Preventative practices allow growers to at least estimate what their use may be. Conversely, insecticides are often used in response to pest thresholds and their use in a given season may be more difficult to predict. In agricultural settings, complete eradication of pests is typically not feasible nor cost effective. It is more common for growers to suppress pests to economically tolerable levels and balance the cost of management with the yield and quality benefits.
Once potential pests have been identified and goals established, you need to monitor to confirm their presence. Monitoring should include using a mixture of all available techniques including scouting, trapping and weather data including pest modeling if available. Michigan growers have a real advantage when it comes to monitoring as many important pest models are provided via the Enviroweather website (https://enviroweather.msu.edu/) that uses weather data to help growers make management decisions.
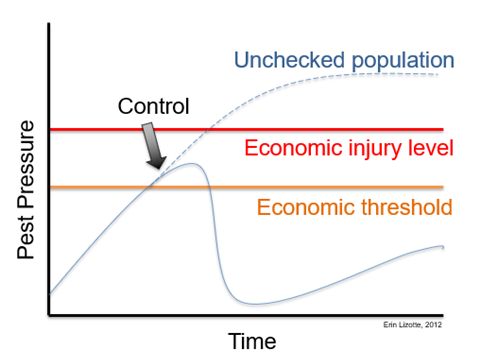
Once pest presence has been confirmed, you’ll need to determine an action or economic threshold. The goal of the economic threshold is to identify the point in time at which growers need to implement management strategies (in this case pesticides) to prevent pest levels from causing economic injury.
Economic injury levels (EILs) are the point at which the pest will cause an economic loss (Figure 1). EILs consider pest management costs (C), commodity market value of crop being grown (V), yield loss from damage and injury per pest (DI) and pest control or management efficiency (K).
Economic injury levels are calculated using the formula: C ÷ (V x DI x K)
The economic threshold is reached when pest pressure necessitates a pesticide application to avoid economic injury. Thresholds vary by pest, site, and even the season, which makes establishing an accurate threshold often difficult. Many economic thresholds are estimates set well below the EIL and are often expressed as insects per leaf or percent infection. For example, thresholds may be based on a percentage of the EIL (such as 80%), or on “guestimates” from research findings (such as 250 soybean aphids per plant in a soybean field).
In order to implement your pesticide plan, you need to first review that you’ve gone through the initial IPM steps.
- Have you identified and monitored the pest?
- Have you set action or economic thresholds?
- Have you identified other non-pesticide control strategies that will work? Pesticide use is recommended when it is the most effective and least harmful method available.
The next step is to select the appropriate pesticide. Pesticide selection is primarily based on efficacy and cost, but should also consider resistance management, beneficial insect protection, applicator safety and environmental impacts. In most cases, growers will need to purchase at least two different products with differing modes of action and rotate between them as needed throughout the season. This rotation, in combination with non-chemical pest suppression tactics can help delay or prevent the development of resistance and may also be needed due to season long maximum application limitations.
Review all label requirements and observe all local, state, and federal regulations when making applications. Always use correct application rates and timing listed within the label. Growers are encouraged to contact their MSU Extension educator (https://www.canr.msu.edu/agriculture/experts) of choice for questions or concerns with specific labels.
No plan is complete without recording and evaluating results. You need to know what worked and what did not. So, keep good records of scouting and monitoring data including insects per trap, percent infection, and other details. You may find that products were ineffective or damaged your crop, beneficial insects, or created other concerns. The key is to use knowledge gained from evaluating results in your future planning efforts.
For more information on pest management in your crop of interest, visit the agriculture section of the IPM Michigan State University website (https://www.canr.msu.edu/ipm/agriculture/).
Costs of a Pesticide Plan
Identifying the costs of a pesticide plan can involve several factors. These can include the cost of labor, pesticide products, and production application. The cost of the products themselves tend to be the most variable, while costs for labor and product application are relatively more uniform across acres. Wages per hour for employees typically remain the same and applicators hired for custom work tend to charge a standard rate per acre. For more information on these custom rates, view the MSU Custom Machine and Work Rate Estimates factsheet at https://www.canr.msu.edu/resources/custom-machine-work-costs.
To better understand the variable costs of pesticide products, let’s start by reviewing potential pests and products outlined in several example pesticide-use scenarios.
Fungicide Scenario (Apple Scab)
Apple scab is a perennial issue in apple production. You noticed some scabby apples and leaves with lesions last year and already know it will be popping up in the spring (Figure 2). You also know that the only effective management of scab is preventative applications. Once you see lesions form, there is no going back!
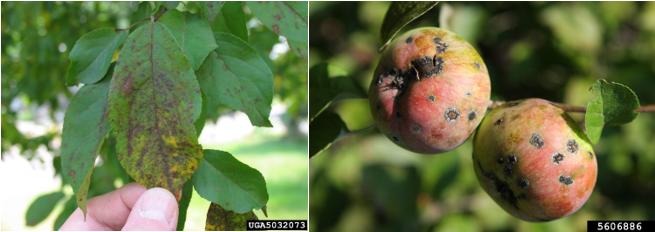
Apple scab has two stages during the growing season. The overwintering primary inoculum emerges from the leaf litter just as trees break dormancy. The primary spores require moisture to develop and eject from the leaf litter into the tree canopies. Primary spores will continue to release during rain events until the spores are depleted, typically around Memorial Day weekend. Keeping good fungicide cover during this time is essential to suppressing disease season long because when primary spores establish leaf infections secondary spores are produced and continue to infect leaves and apples through the growing season in a polycyclic disease cycle.
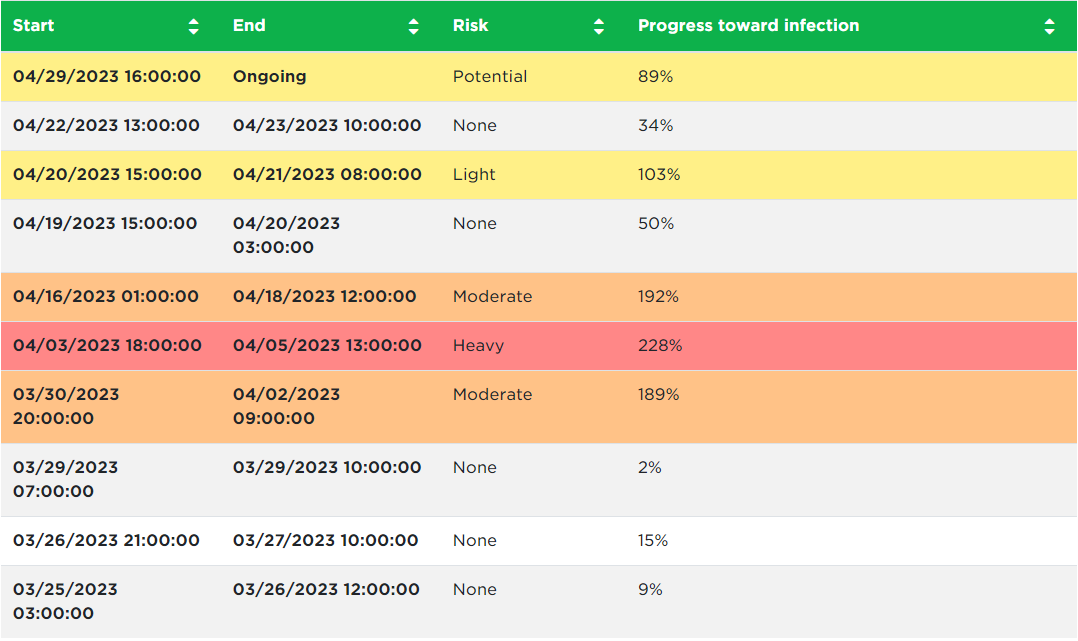
Extension educators monitor the apple scab primary spore populations during rain events in the spring and publish weekly articles to keep growers informed of the timeline for primary apple scab. There is also an Enviroweather model to help determine risk events so growers can optimize preventative fungicide applications. (Figure 3).
There are a number of products with different modes of action available to control apple scab. The Fungicide Resistance Action Committee (FRAC) organizes modes of actions and fungicide product active ingredients into groups. The FRAC Code List of groups can be found at the FRAC website (www.frac.info/). Your Extension educator helps you identify products within those groups that are highly effective for scab management. These products fall into either group 3, 7, 9 or 11. Reviewing the MSU Fruit Management Guide’s efficacy rates (shop.msu.edu/products/2024-fruit-management-guide-downloadable-pdf), some of the most effective products within the groups can be found under various tradenames. Examples include Excalia, Aprovia, Merivon, and Miravis.
Understanding modes of action and resistance management is important for product selection. Apple scab populations are known to have resistance to sterol biosynthesis inhibitor (FRAC 3)) and strobilurin (FRAC 11) fungicides. Resistance guidelines recommend tank mixing those products with a broad-spectrum fungicide product like captan or an EBDC (ethylene bisdithiocarbamate) product.
You are familiar with the products Excalia and Aprovia because a neighboring apple farm mentioned using them in previous years. You contact your local retailer, who tells you that they sell Aprovia at their location. Obtaining a copy of the product label, you review Aprovia’s use for apple scab. The labeled application rate is 5.5 to 7 fluid ounces per acre. No adjuvants are required. The product can be applied every 7-10 days. Not to exceed four applications or 28 total fluid ounces per acre for the year. A minimum of 10 gallons of water per acre is also needed for each application. The product can be used for preventative, curative, or based on the time period of expected infections.
Researching potential costs, you identify that you own the required personal protective equipment (PPE). Your sprayer is also equipped with the appropriate nozzles and meets all spray capacity requirements. The only cost still required is to purchase the product. Your local farm retailer tells you Aprovia is available for $700 per gallon. The retailer asks you how much you’ll need for your 10 acre farm. To answer the retailer’s question, you need to identify which method of application and its cost per acre aligns with your management goals.
For this disease, you already know that preventing apple scab is your primary management goal. To calculate a preventative method’s cost per acre, start by converting the cost per gallon into a cost per ounce. There are 128 ounces in a gallon. The cost per gallon of $700 can be converted to ounces by divided by 128. The result is $700 per gallon becomes $5.47 per ounce (Table 1).
Table 1: Example of Calculating Fungicide Cost Per Acre
|
Cost per Gallon |
Ounces per Gallon |
Conversion Formula |
Cost per Ounce |
|
$700 |
128 |
700/128 |
$5.47 |
According to the product label, preventative applications can be made after ¼ to ½ inch green tip through petal fall growth stages (www.canr.msu.edu/apples/horticulture/growth-stages). The time to pass through these stages is approximately six to seven weeks or 42-49 days. That period allows for the labeled maximum of four applications in a year.
The label application range is 5.5 to 7 ounce/acre, so you want to compare the costs on either end of this range. The cost per acre of a single pass at 5.5 fluid ounces would equal $30.09 per acre. At the 7 ounce per acre rate, a single pass would cost $38.29 per acre (Table 2).
Table 2: Example of Application Cost Per Acre Differences by Fungicide Rates
|
Cost per Ounce |
Ounces per Acre |
Cost Per Acre |
|
$5.47 |
5.5 |
($5.47 x 5.5) = $30.09 |
|
$5.47 |
7 |
($5.47 x 7) = $38.29 |
At 5.5 ounces on all four applications, a total of 22 (5.5 x 4) fluid ounces per acre would be needed. If a higher rate of 7 ounces were used, 28 (7 x 4) fluid ounces per acre would be needed. The total cost of four applications at 22 ounces per acre would be $120.34 versus 28 ounces per acre at $153.16 (Table 3).
Table 3: Example of Preventative Method of Fungicide Application Costs
|
Cost per Ounce |
Ounces per Acre at 4 Applications |
Cost Per Acre |
|
$5.47 |
22 (5.5 x 4) |
($5.47 x 22) = $120.34 |
|
$5.47 |
28 (7 x 4) |
($5.47 x 28) = $153.16 |
With 10 acres of apples, 220 ounces (22 x 10) would be needed at the 5.5 fluid ounce rate. Since Aprovia is sold per gallon, you would need to purchase 2 gallons (220/128 = 1.72) for $1,400 ($700 x 2). At the 7 fluid ounce rate, 280 ounces (28 x 10) would be needed, and 3 gallons (228/128 = 2.19) purchased for $2,100 ($700 x 3). Due to the high susceptibility for apple scab in your region, you decide to use a rate of 7 fluid ounces per acre. You tell the retailer to order three gallons for your farm.
After spraying the fungicide, you continue to monitor your orchard and expected weather patterns over the next week. Knowing the importance of fungicide coverage if conditions are right, you plan for further monitoring and possible fungicide applications through at least Memorial Day weekend.
Fungicide case scenario provided by Lindsay Brown and Erin Lauwers, MSU Extension. Reviewed by Emily Lavely and Cheyenne Sloan, MSU Extension.
Herbicide Scenario (Glyphosate-Resistant Waterhemp)
You notice weeds are starting to break all over your Roundup Ready soybean field (Figure 4). It’s only been a few weeks since your pre-emerge herbicide application, but you can tell it’s had poor efficacy. The soybeans have also only recently emerged, and you know they won’t grow fast enough to outcompete the established weeds. Because there is a wide variety of weed species in the field, you decide a broad spectrum herbicide is your best option. You select Roundup PowerMax (glyphosate) as the best choice for managing the weed populations since it’s labeled to eliminate the weeds you’ve identified.
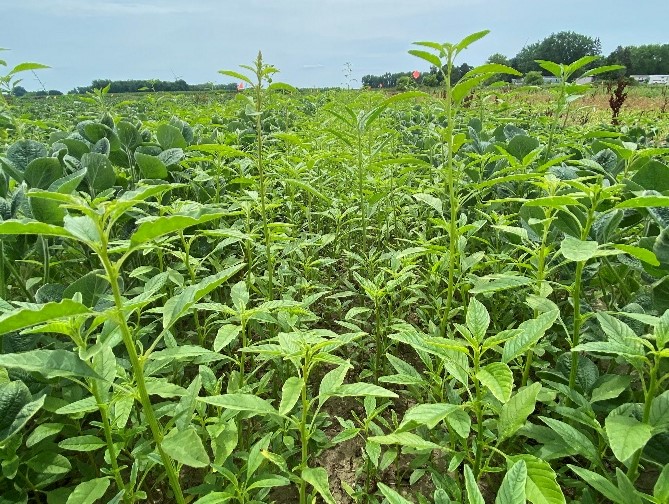
| Figure 4. Waterhemp in soybeans. Photo by Christy Sprague, Michigan State University. |
Researching the label, you find that you own the required personal protective equipment (PPE). Your sprayer is also equipped with the appropriate nozzles and meets all spray capacity requirements. The labeled application rate is 22 fluid ounces per acre based on the size of the weeds. Ammonium sulfate (AMS) in a spray grade form is also recommended as an adjuvant at 8.5 to 17 lbs. per 100 gallons of water. A minimum of 6 or maximum of 40 gallons of water per acre is allowed for each application. You decide to use 8.5 lbs. per 100 gallons with a water volume of 20 gallons per acre.
Your local retailer has Roundup PowerMax available in a 2.5-gallon container for $80 (or $32 per gallon). Spray grade AMS is also available for $30 in a 51 lb. bag or $0.59 per lb. The soybean field you’re spraying is 25 acres. The retailer asks you how much you’ll need for each product.
At 22 ounces per acre, you’ll need a total of 550 ounces for your field. Dividing 550 by 128 ounces per gallon reveals you’ll need 4.3 gallons. You tell the retailer you’ll buy two 2.5-gallon containers of Roundup PowerMax or a total of 5 gallons. For the AMS, you’ll need 8.5 lbs. per 100-gallon tank. Using 20 gallons of water per acre, a tank mix will cover five acres. Multiply 20 gallons by 25 acres reveals you’ll need 500 gallons or five tank mixes. Five tank mixes multiplied by 8.5 lbs. equals 42.5 lbs. of AMS needed. Since the retailer sells AMS in 51 lb. bags, you purchase one bag.
With 5 gallons of Roundup PowerMax and 51 lbs. of AMS, you will have some product remaining after applications. How much is your cost per acre for the actual application? The answer can be found by considering the cost of your total product needs and the acres being sprayed.
Table 4: Example of Calculating Cost Per Acre of Roundup PowerMax Herbicide and Adjuvant
|
Cost Per Unit |
Total Unit Needs |
Total Cost |
Applied Acres |
Cost Per Acre |
|
$32/gallon |
4.3 gallons |
$32 x 4.3 = $137.60 |
25 |
$137.60÷25 = $5.50 |
|
$0.59/lb. ammonium sulfate |
42.5 lbs. |
$0.59 x 42.5 = $25.00 |
25 |
$25.00÷25 = $1.00 |
|
Totals |
|
$162.60 |
25 |
$6.50 |
Table 4 illustrates that Roundup PowerMax will have a total cost of $137.60. AMS will have a total cost of $25.00. In combination, both herbicide and adjuvant will cost $162.60. The per acre cost of Roundup PowerMax on 25 acres equals $5.50, while AMS will cost $1.00. The total per acre cost for the application is $6.50 (Table 4).
After spraying, you know that it takes several days before you see a visible effect from glyphosate. Herbicide efficacy is also partially dependent on the weather. Warm, sunny weather is ideal for glyphosate to move in the plant and have a greater effect. After waiting five to seven days, you return to the field and notice that most of the weeds are wilting, yellowing, or dead. However, there is one weed that seems to have not been affected at all. You have had warm, sunny weather the past week, so herbicide efficacy shouldn’t have been affected by the weather. You walk large loops through the field and find a consistent range of light to moderate weed populations. Each population is unaffected by the recent herbicide application.
The weed is most likely waterhemp and not its cousin Palmer amaranth because of the glossier leaf, shorter petiole length, and lack of seedling leaf hairs on any of the weeds. To make sure, you take a picture of the weed and send it to your local MSU Extension field crops educator who confirms it is waterhemp. Your educator tells you that some waterhemp in the area has gained resistance to glyphosate. They direct you to the herbicide resistance map (www.canr.msu.edu/pestid/resources/plant-and-weed-identification/map) that highlights where resistance has been identified. They also explain that even if your county doesn’t have a documented case of glyphosate-resistant waterhemp, it’s still possible to have resistance in fields. They also list some control options and direct you to the MSU Weed Control Guide for Field Crops (www.canr.msu.edu/weeds) for further treatment guidance.
You weigh your options. The waterhemp populations in your field are moderately dense, and they are distributed throughout the whole field. From the density levels, you are confident that there is potential to reduce soybean yields. Furthermore, if they go to seed, they will create problems for the following years, especially if they are resistant to glyphosate. You also would like to know for sure if you have glyphosate-resistant waterhemp in your fields. However, you can only send seed samples to the MSU Plant and Pest Diagnostics Lab (www.canr.msu.edu/pestid/). To collect seeds, you’d have to wait a couple of months until the weeds mature and produce them. In the meantime, you also need to kill the waterhemp as soon as possible. It is already two inches tall and will soon be too tall to control (Figure 5).
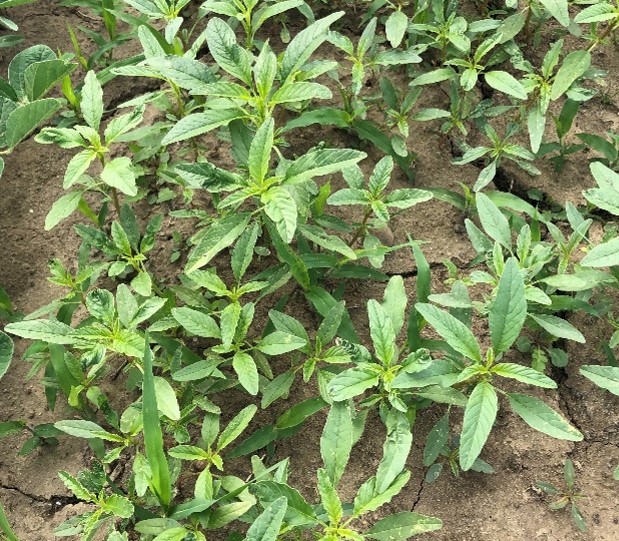
| Figure 5. Dense waterhemp 2-4” tall. Photo by Christy Sprague, MSU. |
You consult a table in the MSU Weed Control Guide for Field Crops that shows you the efficacy of various herbicides on different weeds in soybeans. As you look at the table, you see that most group 14 herbicides such as Cobra (lactofen), Reflex (fomesafen), and Ultra Blazer (acifluorfen) have good efficacy on waterhemp. These are also some of the control options listed by your MSU Extension educator. However, a footnote warns that some waterhemp populations are also resistant to group 14 herbicides in addition to glyphosate.
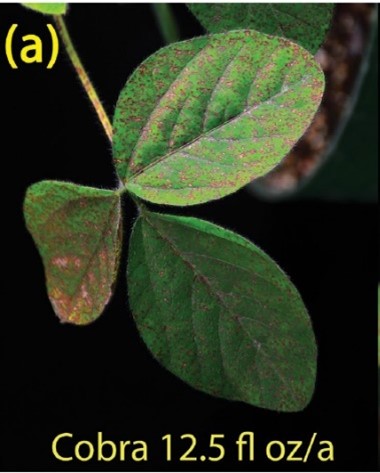
| Figure 6. Cobra (lactofen) damage to soybeans. Photos by Amit Jhala, University of Nebraska-Lincoln Extension. |
You contact your local MSU Extension field crops educator again and also a trusted ag retailer in the area. You ask both individuals if they’ve seen evidence of group 14 herbicide resistance and learn that they’ve seen good control of waterhemp by group 14 herbicides. You check the product labels for use rates, required PPE, restrictions, and other information. The label warns that you will see some foliar spray damage on the soybeans, but it shouldn’t significantly affect yield (Figures 6). At this point, you believe that the weeds would rob more yield than herbicide spray damage. The label also mentions some pre-emerge suppression to waterhemp, which is good since your original pre-emerge herbicide didn’t have the best efficacy.
You decide to apply Cobra at the rate of 12.5 fluid ounces per acre. A rate of 12.5 ounces is recommended for the waterhemp height in your field. Reading the label, you notice that you’ll not only need the product but a crop oil concentrate (COC) as an adjuvant. Your local retailer provides you with a label for their crop oil concentrate product as well. Comparing both labels, you confirm that you own the required personal protective equipment (PPE). Your sprayer also meets all spray capacity requirements, and you own the appropriate nozzles. You also confirm that one quart per acre is the appropriate rate for COC use with Cobra herbicide applications.
Your retailer tells you that they have Cobra available in a 2.5-gallon container for $400 (or $160 per gallon). At 12.5 ounces per acre, you calculate you’ll need 312.5 ounces (12.5 ounces x 25 acres) or 2.44 gallons (312.5 ounces ÷ 128 ounces per gallon). You purchase one 2.5 gallon container of the herbicide.
Using an application rate of one quart per acre for the COC, you’ll need 25 quarts (1 quart x 25 acres). There are 16 ounces to a quart, which means that a gallon of 128 ounces contains four quarts. The retailer has COC in 2.5-gallon containers as well for $45 (or $18 per gallon). At four quarts per gallon, you calculate that 6.25 gallons (25 acres ÷ 4 quarts) will cover your 25 acres. The retailer sells you three 2.5 gallon containers (or 7.5 gallons).
Similar to your application of Roundup PowerMax, you will have some product remaining after applying Cobra. How much is your cost per acre for this herbicide application? The answer is again found by considering the cost of your total product needs and the acres be sprayed.
Table 5: Example of Calculating Cost Per Acre of Cobra Herbicide and Adjuvant
|
Cost Per Unit |
Total Unit Needs |
Total Cost |
Application Acres |
Cost Per Acre |
|
$160/gallon of |
2.44 gallons |
$160 x 2.44 = $390.40 |
25 |
$390.40÷25 = $15.62 |
|
$18/gallon of Crop Oil Concentrate (COC) |
6.25 gallons |
$18 x 6.25 = $112.50 |
25 |
$112.50÷25 = $4.50 |
|
Totals |
|
$502.90 |
25 |
$20.12 |
Table 5 illustrates that Cobra will have a total cost of $390.40. COC will have a total cost of $112.50. In combination, both herbicide and adjuvant will cost $502.90. The per acre cost of Cobra on 25 acres equals $15.62, while COC will cost $4.50. The total per acre cost for the application is $20.12 (Table 5).
When you apply the herbicide, you leave a tiny, untreated portion of the headland. The untreated area allows you to collect waterhemp seed samples for herbicide resistance testing. True to the label, when you return to the soybeans a week later, there is bronzing, speckling, and some necrosis on the upper soybean leaves (Figure 7). Most importantly, damage is obviously visible on the waterhemp as all the leaves are necrotic and wilted, and only some stems have a little bit of green left in them. You return over the next couple of days to ultimately assess that you achieved sufficient waterhemp control.
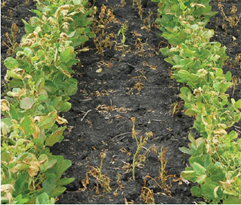
| Figure 7. Cobra (lactofen) damage to soybeans. Photos by Amit Jhala, University of Nebraska-Lincoln Extension. |
As the season progresses, the waterhemp produces seeds. You collect a seed sample according to the MSU Pest and Plant Diagnostics Lab directions (www.canr.msu.edu/pestid/submit-samples/#Weed/plant) and submit it to the lab. Because you are a Michigan soybean grower, testing is free for Palmer amaranth, waterhemp, horseweed/marestail, common lambsquarters, and common and giant ragweed. Finally, you contain the seeds of the remaining waterhemp from the untreated spot by cutting, pulling, and placing weeds into garbage bags.
Herbicide case scenario provided by Nicolle Ritchie, MSU Extension. Reviewed by Eric Anderson, MSU Extension.
Insecticide Scenario (Striped Cucumber Beetle)
Striped cucumber beetles harm a variety of cucurbit crops, including squash, watermelon and cucumbers (Figure 8). While larvae feeding is a concern on roots, adult beetle damage can be more economically harmful. In mid-July, you notice some of these beetles in a yellow sticky card trap set out in your cucumber field. Your crop is a few weeks away from harvest and you don’t want pest levels to reach an economical injury level (EIL).
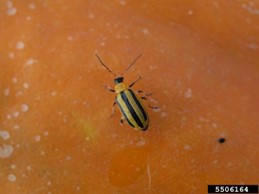
| Figure 8. Striped Cucumber Beetle. Jim Jasinski, Ohio State University Extension, Bugwood.org (https://www.ipmimages.org/browse/detail.cfm?imgnum=5506164) |
Striped cucumber beetles overwinter as adults in field debris or wooded areas, emerging in April to feed and mate. Adults migrate from the southern U.S., arriving in late June. This species lays eggs at the base of cucurbit plants, which hatch after five to eight days. The larvae feed on crop roots for two to three weeks then pupates underground. Adults defoliate and stunt plant growth (Figure 9). Feeding on flowers can reduce fruit production, and direct feeding on fruits causes scars and pockmarks, which decrease marketability of fruits. The primary economic impact occurs when beetles vector bacterial wilt disease (Erwinia tracheiphila) among cucurbit plants. Plants suffering from this disease wilt in a patchy fashion as the disease spreads, with some leaves looking healthy while others wilt. There is no cure for the disease. Management relies on control of the beetle. Striped cucumber beetles have two generations per year in Michigan. (Buchanan et al, 2017, May)
You reach out to your local MSU Extension educator to talk about control options. Extension educators often scout a number of fields throughout the growing season to monitor for various pest infestation levels. You discuss that the plants are past the fourth leaf stage and your Extension educator highlights that the economic or action threshold would be one adult beetle per plant. The threshold is so small mainly due to the concern over bacterial wilt. You walk the field and consistently identify at least three adult beetles per plant.
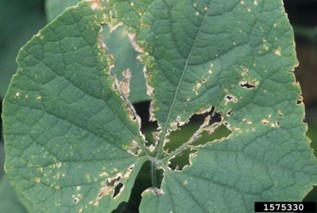
| Figure 9 Cucumber Beetle damage on foliar leaf. Gerald Holmes, Strawberry Center, Cal Poly San Luis Obispo, Bugwood.org (https://www.ipmimages.org/browse/detail.cfm?imgnum=1575330) |
Your Extension educator provides you with a link to the Midwest Production Guide (mwveguide.org/) which lists several control options. It explains that understanding modes of action and resistance management is important for product selection. There are a number of products with different modes of action available to control striped cucumber beetles. These products fall into either Group 1, Group 3, and Group 4. Specific examples include Sevin XLR Plus (carbaryl) Mustang Maxx (zeta-cypermethrin) and Assail 30SG (acetamiprid). You aren’t familiar with any of those products, but your local retailer mentions they have Mustang Maxx and Sevin XLR Plus. You obtain copies of each product label. You read them to identify application rates and instructions, PPE and equipment needs, and overall costs of each product.
The labeled application rate of Mustang Maxx for cucumber beetles is 2.8 to 4.0 fluid ounces per acre. Not to exceed 24 total fluid ounces per acre for the year. No adjuvants are required. The product can be applied every 7 days. A minimum of 10 gallons of water per acre is also needed for each application.
Researching potential costs, you identify that you own the required personal protective equipment (PPE). Your sprayer is also equipped with the appropriate nozzles and meets all spray capacity requirements. The only cost still required is to purchase the product. Your local farm retailer tells you Mustang Maxx is available for $188 per gallon. You consider next how much product you’ll need for your 28 acre field.
Due to the heavy infestation, you determine that a rate of 4.0 fluid ounces would be needed. At 4.0 ounces per acre, you’ll need a total of 112 ounces for your field (28 x 4). Divide 112 by 128 ounces per gallon reveals you’ll need 0.88 gallons (or one gallon of purchased product). Purchasing one gallon will leave a small amount of product remaining after applications. How much would your cost per acre be for the actual applications?
Table 6: Example of Calculating Cost Per Acre of Mustang Maxx Insecticide
|
Cost Per Unit |
Total Unit Needs |
Total Cost |
Applied Acres |
Cost Per Acre |
|
$240/gallon |
0.88 gallons |
$240 x 0.88 = $211.20 |
28 |
$211.20 ÷ 28 = $7.54 |
|
Totals |
|
$211.20 |
28 |
$7.54 |
The answer can be found by considering the cost of your total product needs and the acres being sprayed. Multiplying $240 per gallon of Mustang Maxx against the 0.88 gallons needed equals $211.20. Dividing $211.20 by 28 acres reveals a value of $7.54 per acre. (Table 6).
Alternatively, the labeled rate of Sevin XLR Plus for cucumber beetles is one quart per acre. Not to exceed six quarts per acre for the year. No adjuvants are required. Water volume does not have a minimum requirement but needs to be sufficient to adequately cover crops being sprayed.
Similar to Mustang Maxx, you own the required Personal Protective Equipment (PPE). Your sprayer is also equipped with the appropriate nozzles and meets all spray capacity requirements. The product can be applied every 7 days. The only additional cost is the purchased product needed for 28 acres.
Your local farm retailer tells you Sevin XLR Plus is available for $188 per 2.5 gallon containers. Because there is only one rate listed, you know that you’ll need 28 quarts. Divide 28 by 4 quarts per gallon reveals you’ll need seven gallons (or three 2.5 gallon containers of purchased product). You calculate the cost per acre based on quarts per gallon.
Table 7: Example of Calculating Cost Per Acre of Sevin XLR Insecticide
|
Cost Per Unit |
Unites Per Container |
Total Cost Per Acre |
|
$188 per container (2.5 gallons) |
2.5 gals x 4 quarts = |
$188 ÷ 10 = $18.80 |
|
Totals |
|
$18.80 |
Each 2.5 gallon container will spray a total of 10 acres. Each 2.5 gallon container contains a total of 10 quarts (2.5 gallons x 4 quarts). Dividing the $188 per container by 10 quarts reveals a cost per acre of $18.80 (Table 7).
Comparing the costs of both products, you find that Mustang Maxx will cost $7.54 per acre. While Sevin XLR Plus is much more expensive at $18.80. Across all 28 acres, Mustang Maxx will cost $211.12 and Sevin XLR Plus will cost $526.40 (Table 8).
Table 8: Example Comparison of Mustang Maxx and Sevin XLR Plus Insecticide
|
Product |
Cost Per Acre |
Total Acres Applied |
Total Program Cost |
|
Mustang Maxx |
$7.54 |
28 |
$211.12 |
|
Sevin XLR Plus |
$18.80 |
28 |
$526.40 |
An additional cost factor is time and fuel per application. Although rated better, two applications of Mustang Maxx may be needed. You calculate that two applications could equal or exceed one application of Sevin XLR Plus. However, you may also have to make multiple applications with Sevin XLR Plus.
In addition to the costs, you do some extra research to compare tradeoffs between both products. You review the following:
- When reading the labels, you noticed that Mustang Maxx has an intermediate risk for runoff, which could become a concern in your field.
- Sevin XLR Plus creates an inhalation hazard and requires the use of a respirator, which you own but prefer not to use.
- Mustang Maxx appears to have a slightly better relative effectiveness scoring. Scoring is based on a chart from page 182 of the Southeastern Vegetable Crop Handbook (https://www.aces.edu/blog/topics/vegetable-crops/southeastern-us-vegetable-crop-handbook/) your Extension educator referenced.
- The discussion on resistance management with your Extension educator also highlighted that both products were non-selective. Because they target more than just cucumber beetles, there could be additional insects that are affected. Minimum applications are recommended for this reason.
- Both products have been in existence a long time and continuous use by farms over time could mean some insects may already be resistant to the active ingredient. This could mean an alternative product is needed or another form of control. There are no guarantees when spraying pesticides.
- Mustang Maxx is a low volume product, which could be challenging to mix correctly.
Considering the tradeoffs, you decide that the advantages of Mustang Maxx outweigh the disadvantages. The low use-rate combined with a higher rated effectiveness compares well with the cost per acre. You purchase one gallon from your retailer and spray the insecticide.
You inspect the field several days later to evaluate the effectiveness of the pesticide application. Scouting the field, you look for signs of beetle and larvae populations. Finding no signs of adult beetles or increased signs of feeding, you determine that your application was successful.
Insecticide case scenario provided by Jon LaPorte, MSU Extension. Reviewed by Ben Phillips and Christopher Galbraith, MSU Extension, as well as by Dr. Zsofia Szendrei, Michigan State University.
As you think about pesticide planning, remember that detailed planning can help reduce the costs and overall impacts to revenue. You can accomplish this by relying on integrated pest management strategies and techniques. Taking advantage of those strategies can reduce the amount of pesticides to apply and still ensure that your plan meets your intended yield goals.
Most importantly, a detailed pesticide plan helps to meet the pest control needs of your crop at the lowest possible cost.
Pesticide Cost Comparison Decision Tool
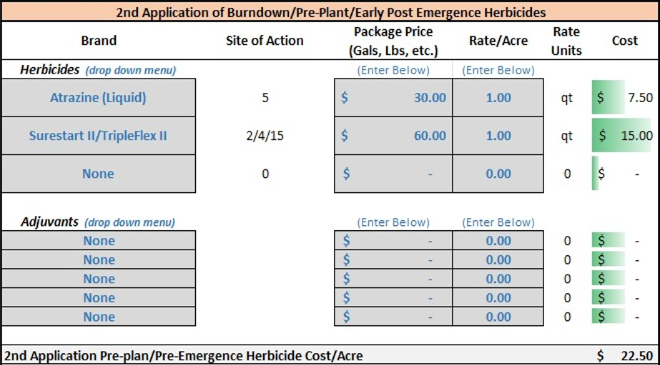
| Figure 10. Excerpt of Pesticide Cost Comparison Decision Tool Corn Example. Photo by Jon LaPorte, MSU Extension. |
The Pesticide Cost Comparison Decision Tool allows producers to consider strategies and product costs. Building upon science-based research, the comparison tool uses fungicide, herbicide, and insecticide information to develop a pesticide plan. Multiple plans can be compared with each listing a total cost per acre summary that assists in finding a mix of products that meet IPM needs at the lowest possible cost (Figure 10).
Versions of the tool are available for field crops and vegetable production. In both versions, identifying chemical product prices and rates is needed in order to effectively use the tool. Additional products can be added for comparison, using product label information. To download the Pesticide Cost Comparison Decision Tool for Field Crops, visit: https://www.canr.msu.edu/resources/pesticide-cost-comparision-decision-tool. To download the Pesticide Cost Comparison Decision Tool for Vegetables, visit: https://www.canr.msu.edu/resources/pesticide-cost-comparison-decision-tool-for-vegetables.
Reference:
Buchanan, A., Bryant, A., Morrison III, W., Werling, B., Quinn, N., and Szendrei, N. (2017, May). Striped and spotted cucumber beetles as pests of cucurbits in Michigan. Michigan State University. https://www.canr.msu.edu/news/striped_and_spotted_cucumber_beetles_as_pests_of_cucurbits_in_michigan