


Annual ACSE Yield and Profit
Economic reports highlight yield and profitability as the project expands, offering a comprehensive annual summary. See the tables and graph below.
2024 Economic Summary – LTAR ACSE Plot Averages
|
2024 Crop |
Business as Usual (BAU) |
Aspirational (ASP) |
Michigan Average Yields |
||
|
2024 yield |
2024 profit |
2024 Yield |
2024 Profit |
||
|
Corn |
216.4 Bu/A |
$287.88/A |
226.2 Bu/A |
$379.72/A |
181 Bu/A |
|
Soybeans |
77.5 Bu/A |
$473.43/A |
59.8 Bu/A |
$228.71/A |
49 Bu/A |
|
Wheat Grain Wheat Straw Cover Crop ASP Wheat Total |
|
|
95.4 Bu/A 1.0 Tons/A 1.7 Tons/A |
$226.24/A $67.70/A $57.79/A $351.72/A |
87 Bu/A |
|
ASP Canola |
|
|
2,351 lbs/A |
$287.85/A |
NA |
|
ASP Forage |
|
|
6.2 Tons/A |
$467.30/A |
2.73 Tons/A |
|
Whole System |
|
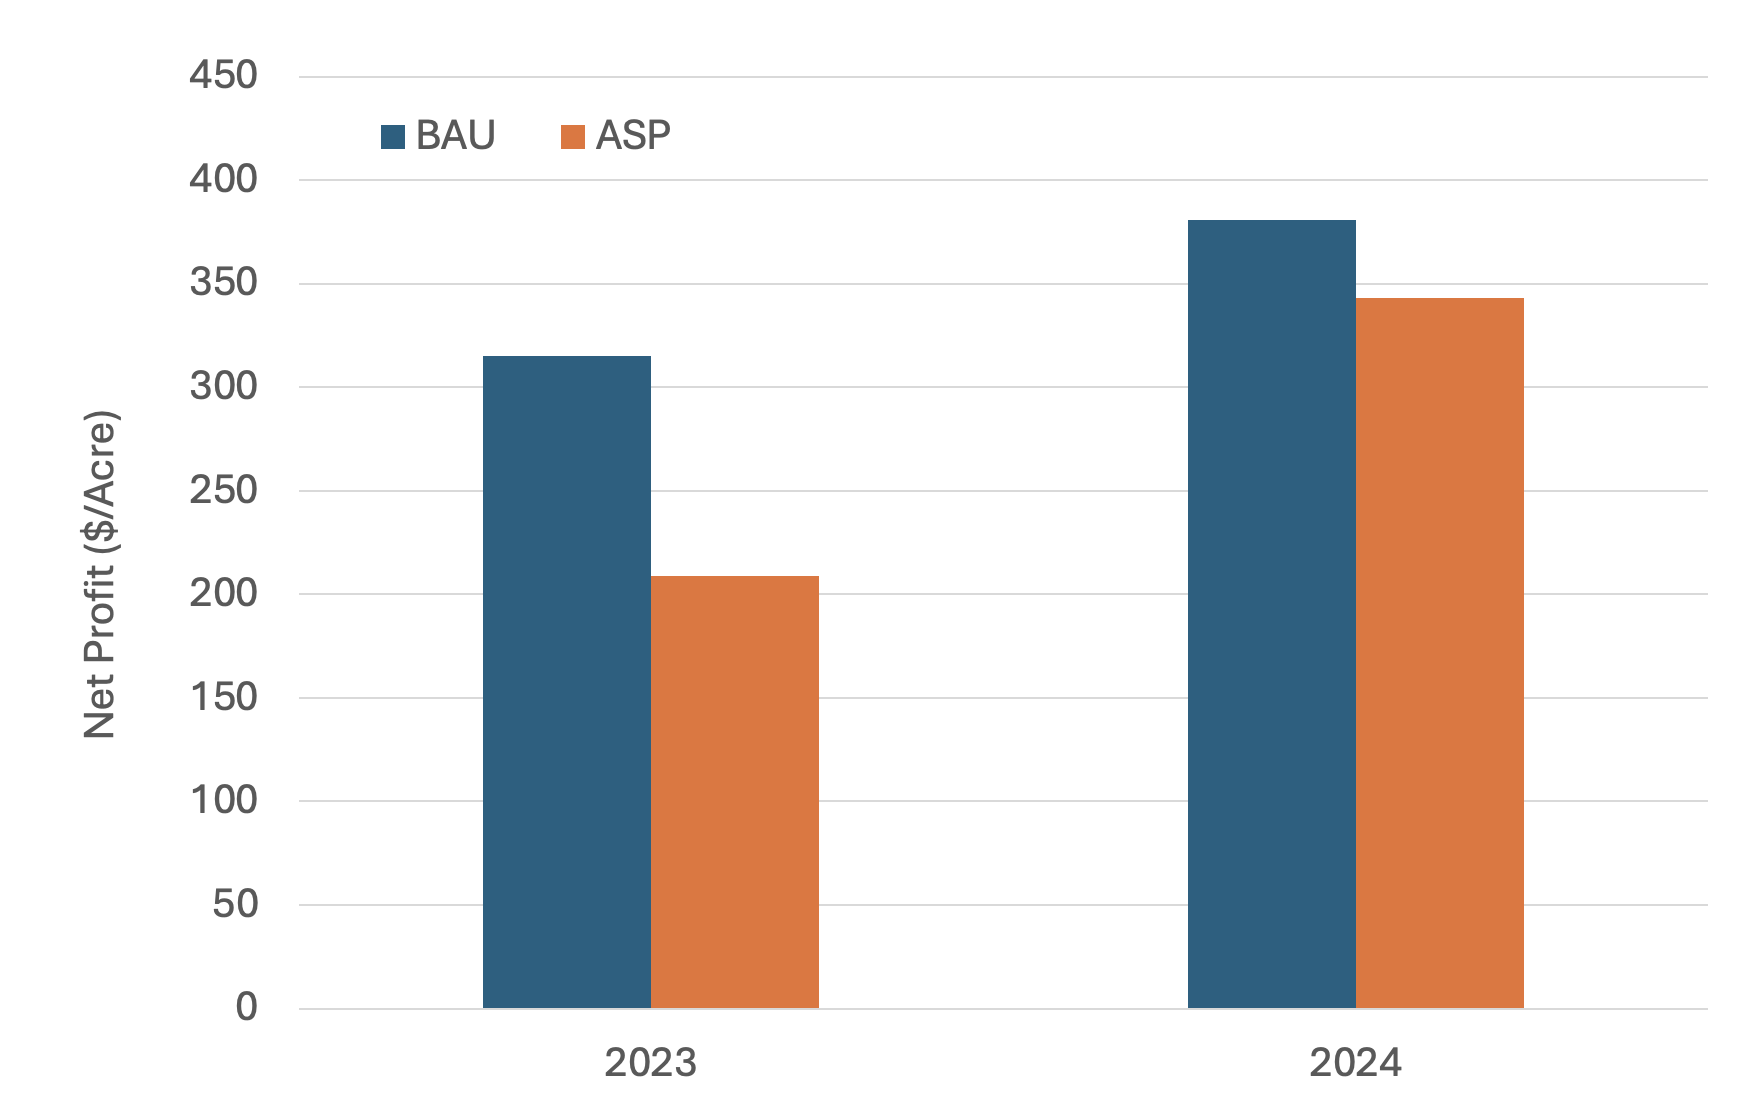
$380.66/A |
|
$343.06/A |
|
(Charles, Hasenick, Dykstra, Robbins, & Wilke 2024)
2023 Economic Summary – LTAR ACSE Plot Averages
|
2023 Crop |
Business as Usual (BAU) |
Aspirational (ASP) |
Michigan Average Yields |
||
|
2023 yield |
2023 Profit |
2023 Yield |
2023 Profit |
||
|
Corn |
179.1 Bu/A |
$279.69/A |
161.5 Bu/A |
$315.45/A |
168 Bu/A |
|
Soybeans |
52.46 Bu/A |
$349.47/A |
47.9 Bu/A |
$279.42/A |
46 Bu/A |
|
Wheat Grain Wheat Straw Cover Crop ASP Wheat Total |
|
|
64.86 Bu/A 1.4 Tons/A 1.6 Tons/A |
$183.84/A $112.20/A $29.61/A $325.65/A |
83 Bu/A |
|
ASP Canola |
|
|
1,773 lb/A |
$180.25/A |
|
|
ASP Forage |
|
|
2.1 Tons/A |
-$54.73/A |
2.73 Tons/A |
|
Whole System |
|
$315/A |
|
$209/A |
|
Yield data from replicated plots. Crop values calculated based on RMA spring projected price. Forage and straw prices based on USDA NASS and local markets ($120/Ton for Straw, $150/Ton for Cover Crops, $200/Ton Perennial Forage). All production costs included except for land and crop consultant.
(Charles, Hasenick, Dykstra, Robbins, & Wilke 2023)
For more information and a breakdown of data for 2023 and 2022, see this article.
System Economics Over Time
 Print
Print Email
Email