Seasonal temperatures, fruit development and storability: How does 2024 compare to the previous 17 years?
 Print
Print Email
EmailField temperatures affect fruit condition and storability. Look back at seasonal temperatures across Michigan and what it means for Gala fruit development.
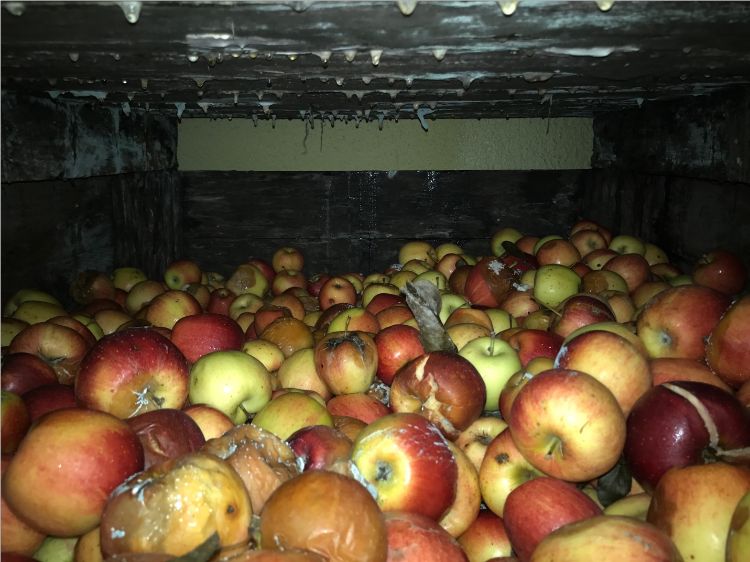
Apple fruit development is highly dependent on the temperature of the environment. Temperature affects bloom date, the rate of growth and the rate of fruit maturation. Post-harvest, it also impacts the rate of ripening and fruit long-term storability. In some cases, the harvest of warm, ripe fruit followed by less-than-ideal storage regimens can result in debilitating losses due to decay and loss in condition; we observed this scenario following a heat wave in 2017 (Figure 1). In the current year, the National Oceanic and Atmospheric Administration reported the January–July global surface temperature of 2024 “ranked warmest in the 175-year record at 1.28 degrees Celsius (2.30 degrees Fahrenheit) above the 20th century average of 13.8 C (56.8 F).” In keeping with these predictions, initial apple maturity assessments for Michigan indicate the current year is approximately advanced by 10 days to two weeks relative to historical averages.
To get a better understanding of the impact of temperature on the apple season and the potential future impact of growing season temperatures, we performed an analysis of the daily growing degree days using a base temperature of 50 F (GDD50). The GDD50 relates to the difference between the average daily temperature and 50 F. We collected Baskerville Emin GDD50 data from the Michigan State University Enviroweather site for the Northwest Michigan Horticulture Research Station (NWMHRS), the Clarksville Research Center (CRC), the Hart Station (HART) and the Southwest Michigan Research and Extension Center (SWMREC) from March1, 2007 to Aug. 31, 2024. Where data were missing (0.5% incidence), we averaged GDD values before and after the omission.
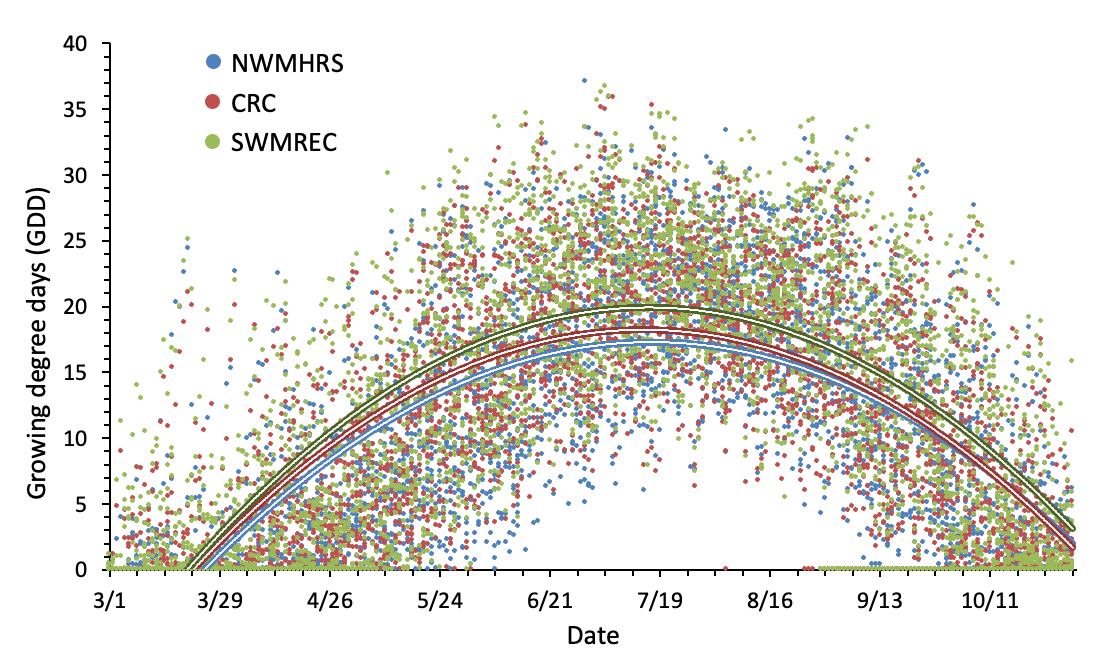
The number of daily GDD50 for each site increased from near zero at the beginning of March to average around 20 GDD50 by mid- July, declining thereafter (Figure 2). Interestingly, the range in GDD, even in July, ranged from as low as 7 to as much as 38. This wide range in GDD was found to be possible for nearly any day of the growing season. Even in mid-March, there were days accumulating as much as 26 GDD. Comparing the seasonal trends for the four sites after the first of May bloom time for apple, SWMREC accumulated approximately 1 to 2 more GDD50 than Clarksville (CRC) and 2 to 3 more than NWMHRS. Surprisingly, there was only a very slight difference in the trends of GDD50 for NWMHRS and HART, with HART being only slightly warmer.
This means the southwest Michigan region gains about 150 – 300 GDD50 on average over CRC and 300 – 450 over NWMHRS. Given that the mid-season average GDD50 is about 20, this translates to one to two weeks advancement for the southern Michigan regions, on average, over the northern apple production regions.
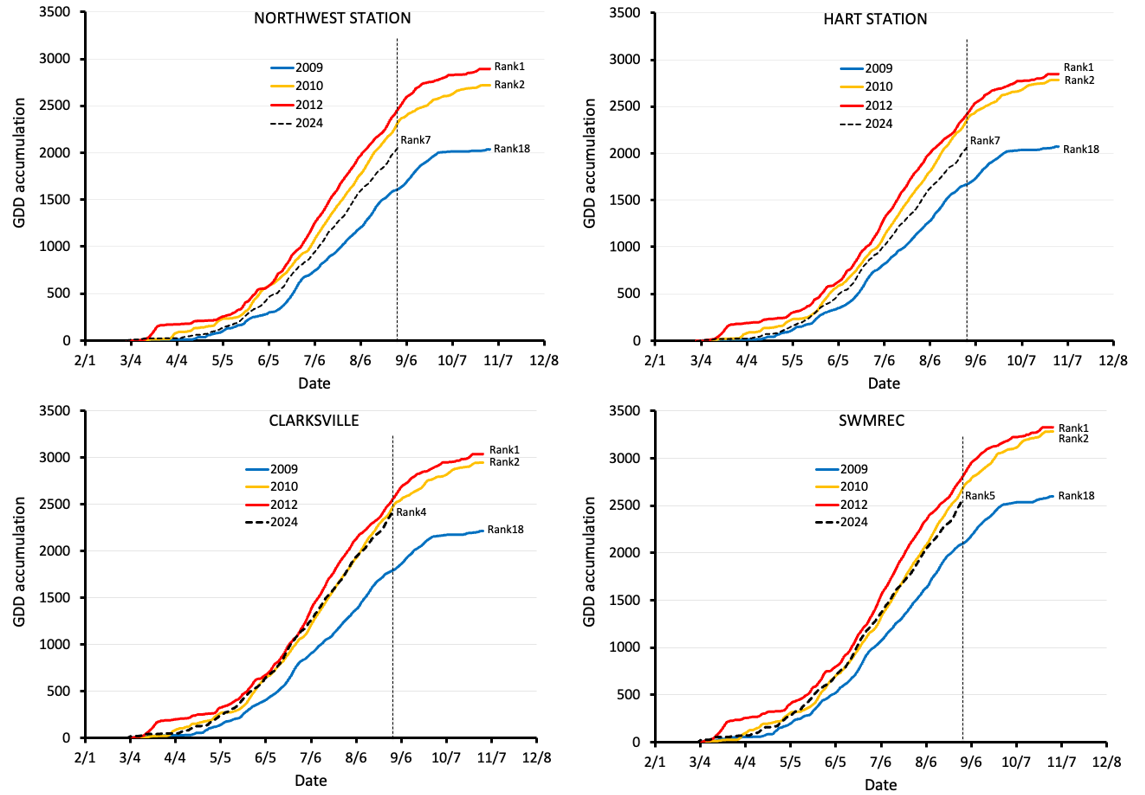
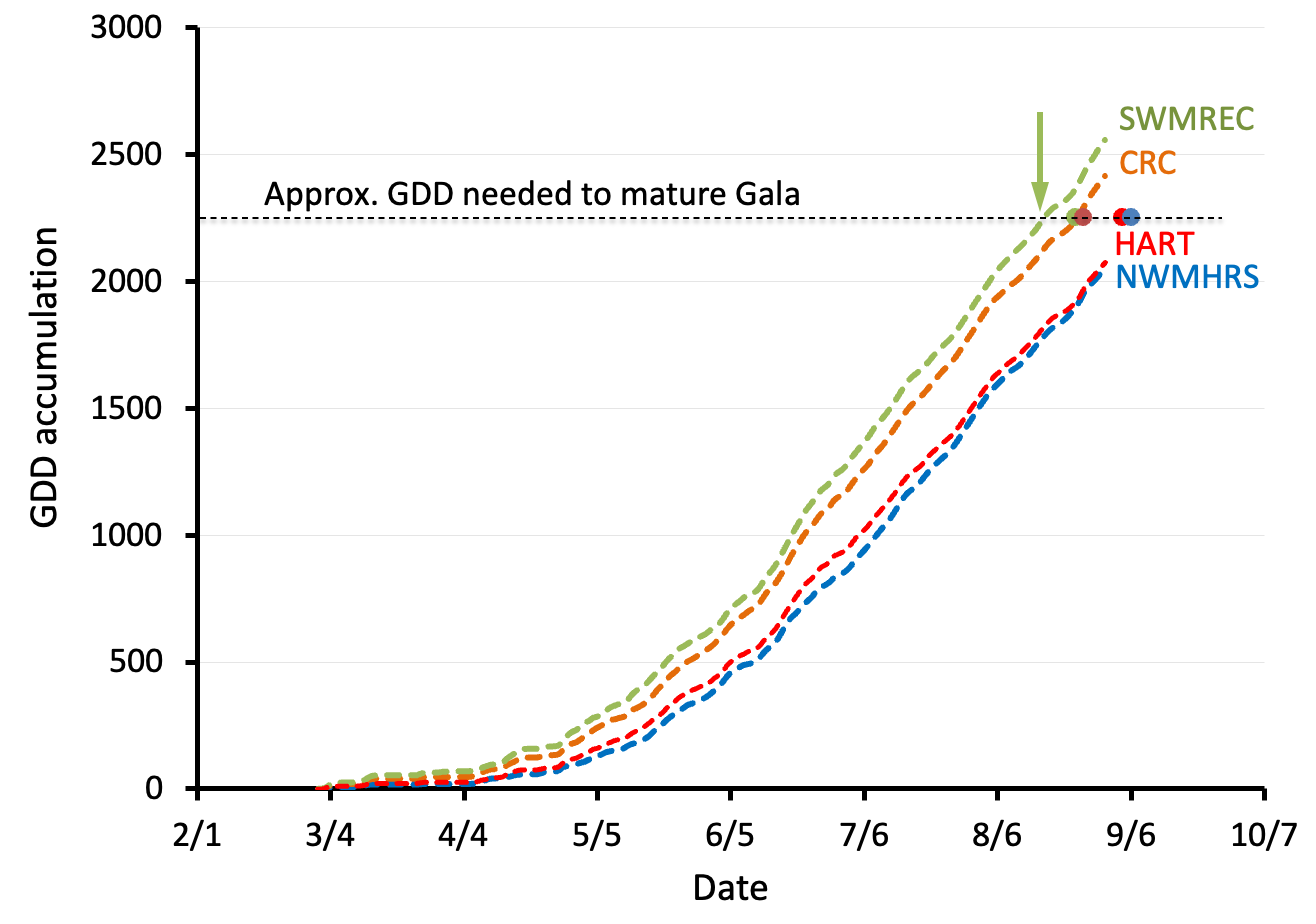
As of the end of August, the cumulative GDD50 was highest in 2012, second highest in 2010 and lowest in 2009 over the past 18 years (Figure 3, Table 1). The year 2024, by Aug. 31, was fourth and fifth highest for CRC and SWMREC and seventh highest for HART and NWMHRS. It is relevant to note that until about Aug. 1, the GDD50 accumulation was second highest ever for the southernmost stations, suggesting a very early harvest date would ensue. In casual observations over the years, the accumulation of approximately 2,200 GDD50 seems to be sufficient to yield mature, ready-to-ripen Gala fruit. In comparing the four regions evaluated, the 2,200 GDD50 maturity dates were anticipated to be Aug. 17 and Aug. 24 for SWMREC and CRC, respectively and anticipated to be Sept. 8 and 9 for HART and NWMRES (Figure 4). These dates are earlier than the dates predicted by bloom data published by Michigan State University Extension for the southern regions, where the temperatures were much higher than average compared to the northern two stations, which experienced only a slightly warmer than normal year (Table 1).
| Table 1. Growing degree days, base 50 F (GDD50) for the five major apple production regions in Michigan (courtesy of Erin Lauwers). | |||||
|---|---|---|---|---|---|
| Region |
Current |
5 Yr Average (2019-2023) |
GDD increase |
Days advancement |
2024 predicted harvest |
|
SWMREC |
2487.3 |
2333.5 |
153.8 |
9.0 |
August 24 |
|
Romeo |
2329.4 |
2225.6 |
103.8 |
6.5 |
August 29 |
|
Sparta 20m |
2234.6 |
2133.2 |
101.4 |
6.3 |
August 26 |
|
Hart |
2017.4 |
1953.1 |
64.3 |
4.3 |
Sept. 4 |
|
NWMHRS |
1995.2 |
1948.8 |
46.4 |
3.1 |
Sept. 6 |
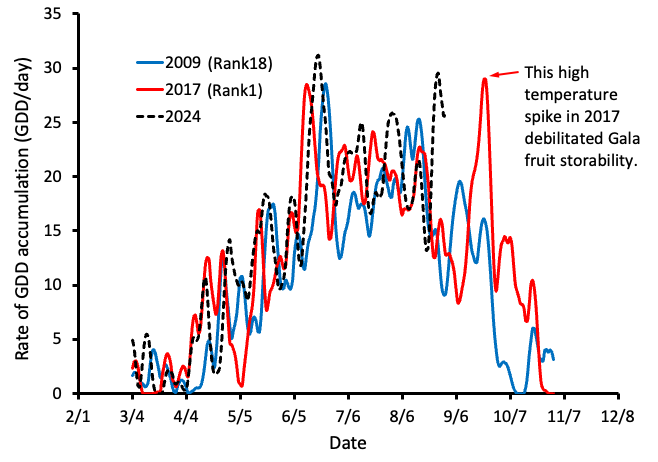
A measure of the environmental heat being experienced by the fruit is the rate at which growing degree days accumulate. When we look at only the southwest station, we see that during the very warm 2017 year, there was a very high spike in the rate of GDD50 accumulation (Figure 5). This coincided with a statewide heat wave in early- to mid-September that dramatically reduced the quality and storability of the Gala crop in the northern regions of the state where Gala had not yet been harvested. This year (2024), a spike in GDD50 accumulation took place in late August, coinciding with the Gala harvest in that region. The inference is that Gala storability might be compromised. Fruit maturity reports from Michigan State University Extension indicate a 5-pound drop in firmness between Aug. 26 and Sept. 3, coinciding with this year’s late summer heatwave (Table 2).
| Table 2. SWMREC maturity data for Gala apple fruit in 2024 (courtesy of Bill Shane). | ||||
|---|---|---|---|---|
|
Date |
Red Color (%) |
Firmness (lbs) |
Starch (1-8) |
Soluble Solids (°Brix) |
|
Aug. 19 |
86 (70-98) |
18.9 (16-22) |
5.0 (2.8-7.4) |
11.6 (11-12.3) |
|
Aug. 26 |
87 (70-97) |
17.2 (14.7-22.3) |
6.0 (4.2-7.0) |
12.8 (12.1-13.4) |
|
Sep. 3 |
99 (97-100) |
12.5 (12-13) |
7.6 (7.2-8) |
12.9 (12.3-14.1) |
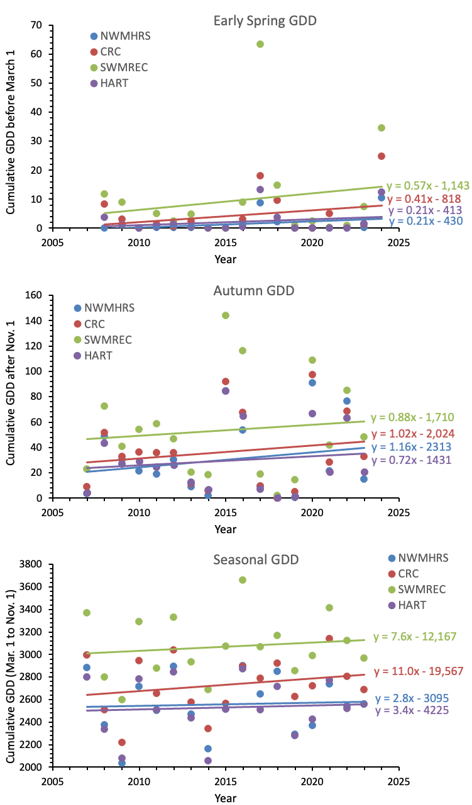
Finally, it may be worthwhile to look at some GDD50 trends in the 18-year span of the data for the four regions investigated to anticipate weather-related shifts in plant responses in the future. If we look at the accumulation of GDD50 before March 1 or after Nov. 1, clear and quite similar trends appear for all four regions (Figure 6). Early spring data shows trends of increasing GDD50 pre-season, averaging about 0.35 GDD50 per year. However, it is notable that the trend in the southern part of Michigan seems to be higher than in the north. Post-seasonal accumulation of GDD50 is also expected to increase. The average rate of increase is about 3 times higher than the spring warming, averaging 0.95 GDD50 per year during this period. The impact of warmer temperatures early and late in the year may impact emergence from and establishment of dormancy, respectively.
During the season, the expectation is that GDD50 accumulation will also increase approximately 7.6, 11.0, 2.8 and 3.4 GDD50 per year in the coming years for SWMREC, CRC, NWMHRS and HART based on the data collected (Figure 6). Since an average seasonal daily GDD50 accumulation during the summer months is currently about 15 to 20 GDD, this means the growing season will shift earlier one day every 2 to 5 years. Of course, this supposes current trends will continue, but they may speed up or slow relative to these observations.
Collectively, the data demonstrate the variability of the seasonal accumulation of GDD50 and provide some insight as to the impact of accumulated GDD50 on fruit maturation and potential for storage. Fruit growth, maturation and ripening are all impacted by temperature; warm years, and even warm spells during the season will alter these physiological processes. Warmer growing seasons will certainly push growers to continue to plant early coloring strains so that color development does not limit consumer acceptability. Additionally, closely monitoring temperatures may help in scheduling the application of harvest aids like ReTain and Harvista and help suppress the impact of early seasons and heat waves on fruit condition following storage.