How to interpret a RIMpro apple scab forecast when making management decisions for your operation
 Print
Print Email
EmailRIMpro apple scab model predictions available for Michigan growers.
Michigan State University Extension’s apple group has adopted the usage of RIMpro apple scab modeling in order to help growers with management decision making. This software is an improvement over former apple scab information that has been shared because it evaluates upcoming risk based on short term weather forecasts, allowing growers to make a plan to address each situation as it arrives. While this comes with huge potential, interpreting RIMpro output can be confusing. Figure 1 is a typical RIMpro apple scab forecast output with labelling on all key components. We will discuss the elements that are most important for farmers to take note of when using this tool.
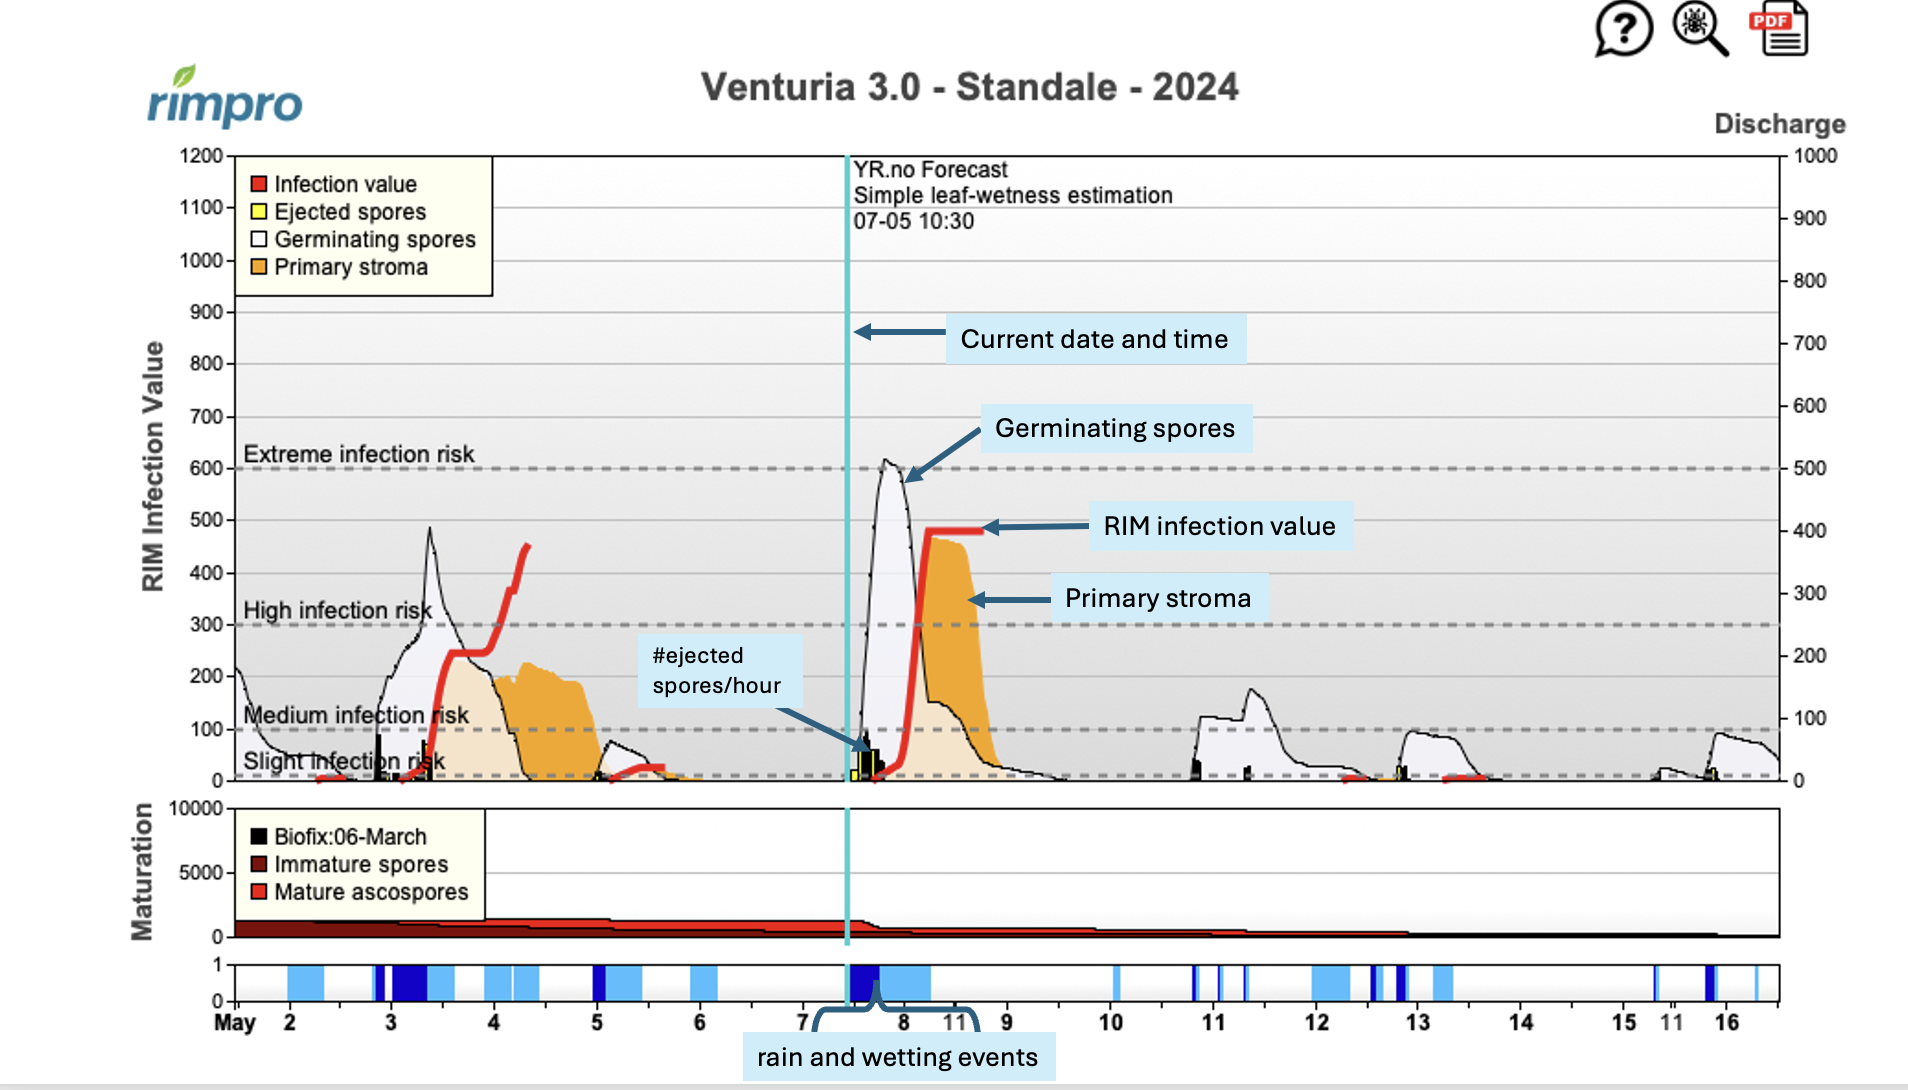
This graph is specific to primary apple scab, during which overwintering ascospores eject from the leaf litter. If these lesions establish a foothold in the canopy, they will enter secondary apple scab. If you see apple scab lesions develop on leaves and fruitlets during primary apple scab season, please refer to the “Scab Secondary” tab which provides further details on infection windows for this disease stage.
When reading this graph, start by finding the light blue vertical line, which is your current date and time. You can see that the line goes all the way down to the bottom of the graph to show you the date. This graph is from the Standale (Sparta) station on May 7, 2024. Everything to the right of the vertical blue line is based on weather forecasts, while everything to the left of that blue line is real recent weather data collected from the nearest NEWA station.
Once you have located your position, the most important thing to look at when considering what you should be doing to address an approaching rain event is the solid red line, labelled “RIM infection value.” This is the visualization of the infection risk associated with an approaching rain event. The rain events are indicated by the dark blue bars on the very bottom of the graph, and the light blue bars are wetting periods that follow when no rain is falling but trees remain wet. Notice on the left side of the graph there are dotted lines running horizontally across the graph which are labelled “slight infection risk,” “medium infection risk,” “high infection risk” and “extreme infection risk.” Management should be considered any time the red line climbs above the “slight infection risk” line. The RIM infection values will be on the y-axis (vertical scale) on the left side of the graph labelled “RIM Infection Value.”
Another useful measurement is the little yellow bars labelled “# ejected spores per hour.” This indicates when the spores are released. Note that they correspond with the solid blue bar at the bottom of the graph, which indicates a rain event. The white areas indicate the cumulative number of scab spores that germinate over time. The orange area indicates the primary stroma, representing that scab lesions were initiated by infection from the germinating spores and are incubating. During this period, fungicides with “kick back” activity can be applied to control infections if preventative fungicides were not applied.
If you are a farmer looking to make a decision about managing ahead of an approaching rain, use the following thought progression: After the rain starts (dark blue bar), the apple scab spores are released (yellow bars). Their probability of infecting your apple tree is then calculated based on environmental data (solid red line), and the risk is summarized by the dotted gray lines running horizontally across the graph (“slight infection risk, “moderate infection risk,” etc.). The severity of the rating gives you the information needed to decide about management ahead of the approaching rain. We recommend managing when the value climbs above “slight infection risk,” and to exercise increasing caution as the value rises toward the maximum rating of “extreme infection risk.” Use your best combinations of systemic and protectant fungicides during the most “high” and “extreme” events each year and focus on protectants during “slight” and “moderate” events.